|
Turbine flow meters are inherently non-linear. A computer at the point of display using a plot of K factor / Flow, often corrects this non-linearity. This method is accurate to ~1% of indicated reading for the particular oil and temperature upon which the meter was calibrated. Flow meter accuracy deteriorates if oil of a different viscosity or the same oil at a different temperature is used.
This project investigates a new method of linearising flow, common to a range of different size turbine flow meters, that is compatible with oils of different viscosity over a range of temperatures. Tests were carried out using oil and using water and the results were plotted against two dimensionless groups: modifications of Strouhal Number and Reynolds Number. The resulting curves for different size flow meters are very similar and are all described by a common mathematical equation. The outcome of this investigation is a method of linearisation that successfully compensates for changes in fluid viscosity and is common to a range of flow meters. The result, in comparison with traditional K factor / Flow linearisation, is improved accuracy, greater flexibility, and a valuable design tool.
1. Introduction
This report is a résumé of research carried out over a period of eighteen months, the majority of which was for the author's final year investigative project at Sheffield University. Final testing and validation of this method is now underway prior to commercial release by Webtec Products Ltd. at the end of this year.
2. Turbine flow meters
The turbine flow meter, also known as a propeller meter, belongs to the family of volumetric flow meters. The basic design consists of a turbine, mounted on bearings, located longitudinally within a machined flow tube. Turbine flow meters tend to be bi-directional and their design includes flow straighteners on either side of the rotor. The rotation is measured by electric or magnetic pickup of the blades as they pass a fixed point. The rotation of the turbine is approximately proportional to the volume flow rate, in general the number of pulses per unit fluid volume over a 5:1 flow range is constant to within a +/- 0.25%. Rotors have two or usually more blades and can be of varying designs.
2.1 The LT range of turbine flow meters
The LT range of flow meters consists of three sizes T1, T2, and T3, these cover flows from 4-125, 15-400 and 25-800 litres per minute (l.p.m) respectively. The flow meters are all of a similar design, namely a machined aluminium body housing a stainless steel six-bladed turbine. The turbine is mounted on stainless steel bearings and fitted between two six-armed flow straighteners. The turbine rotor is of a helical or optimised angle design. Pickup is via a transducer screwed to the top of the block. A thermister is housed next to the transducer and sits flush with the inner wall of the turbine block.
Figure 1
An LT type turbine flow meter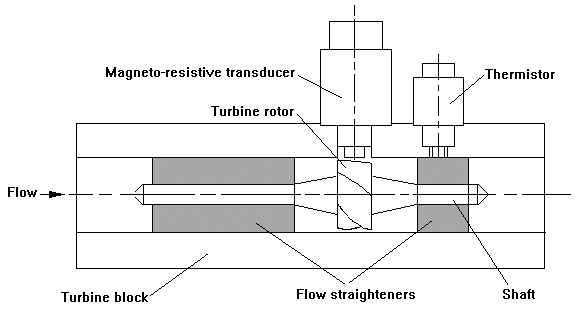
2.2 Linearisation
The volume flow rate of a liquid through the flow meter is proportional to the angular velocity of the turbine. As each blade of the turbine passes the transducer it generates a pulse. Thus the rotation of the turbine results in a stream of pulses, one revolution of the turbine being equal to six pulses for a six-bladed turbine, as used in the LT range. The meter factor is defined as the number of pulses measured by the turbine transducer divided by the flow that generated those pulses and typically has the units pulses per litre or ppl.
At constant flow any resistance offered by bearing friction, magnetic detent and viscous drag is balanced by the driving torque of the fluid impacting the blades of the turbine. However the factors attributable to resisting the flow and hence the rotation of the turbine are non-linear. As a result the inaccuracies caused by these factors become of greater importance at lower flows and even more so for smaller flow meters; those less than two inches in diameter.
With the advent of the microprocessor it is no longer necessary that turbine flow meters demonstrate linear behaviour so long as the non-linear behaviour is repeatable. In this way the curve of meter factor / flow curve can be stored and the correct flow calculated. A typical curve is shown in Figure 2.
Figure 2
A typical K factor / flow curve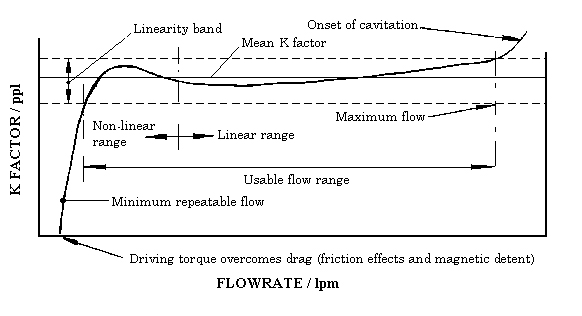
3. Shortcomings of the K factor / Flow curve
3.1 Viscosity
The single greatest influence on the shape of the linearisation curve is the viscosity of the fluid being used. This is of particular importance when dealing with mineral oils; the fluid used the majority of the time in hydraulic power transmission. As the oil temperature decreases, the kinematic viscosity increases. The increase in viscosity results in a more rounded curve; i.e. the initial slope becomes less steep and the linear section of the curve becomes shorter.
The inaccuracy that can result from oil being tested at different temperatures can be of the order of 4% of indicated reading at low flows. Figure 3 shows T2 tested using ISO 32 oil at three different temperatures and plotted on a graph of K factor / flow.
Figure 3
K factor / flow at three different temperatures (viscosity) T2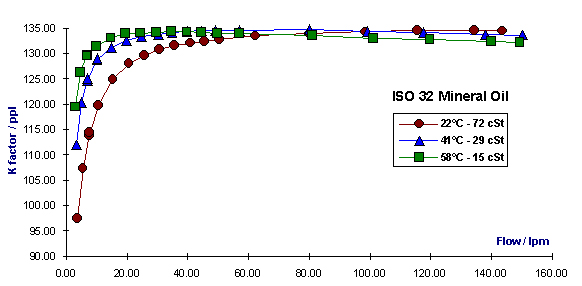
3.2 Dimensions
It is also important to notice that the three flow meters are of different dimensions and hence have completely different K factors. The respective curves whilst similar are not the same, the main difference being in the initial steep section and ëhumpí of the curve as can be seen in Figure 4.
Figure 4
K factor / flow for three sizes of turbine flow meter tested on ISO 32 at one temperature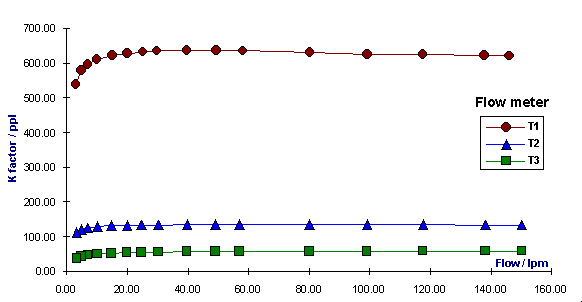
4. Solutions
4.1 One curve for different viscosity fluids
Hochreiter [1] using dimensional analysis predicted the relationship between the meter factor and fluid viscosity, shown in equation below.
Equation 1 
Where f is frequency, Q is flow, is kinematic viscosity, and  denotes function. denotes function.
Hochreiter reported that this equation worked to a limited extent, giving a single smooth curve for fluids of different viscosity but the curve did begin to separate at low flows. The curve does not take into account non-viscous retarding forces and was hence deemed at the time to have little practical use. However this principle has since been adopted by a major flow-measurement company to plot a Universal Viscosity Curve (U.V.C.); namely K factor against frequency / kinematic viscosity. This method was applied to the data from flow meters T1, T2, and T3 as can be seen in Figure 5.
Figure 5
Data from three different size turbine flow meters plotted on the Universal Viscosity Curve
4.2 One curve for different size flow meters
Whilst the U.V.C. successfully amalgamated the results from three different viscosity fluids into one smooth curve, it however had no affect on the relationship between the curves for different size flow meters. The next goal was to find one common curve for different size flow meters.
In Figure 5 the differences between the curves in the x direction were due to the three meters having different internal dimensions. Thus the use of Reynolds number (Re) [2] in place of ëfrequency / kinematic viscosityí brought the curves in line.
Equation 2 
The differences on the y-axis were due to each flow meter having a very different meter factor (number of pulses per litre of flow). Another dimensionless group, Strouhal number (St), was seen as a good equivalent to the meter factor but included an additional constant to remove dimensional differences.
Equation 3 
Figure 6 shows the three curves, similar both in shape and x/y values.
Figure 6
Data from three different size turbine flow meters plotted on a graph of St_m / Re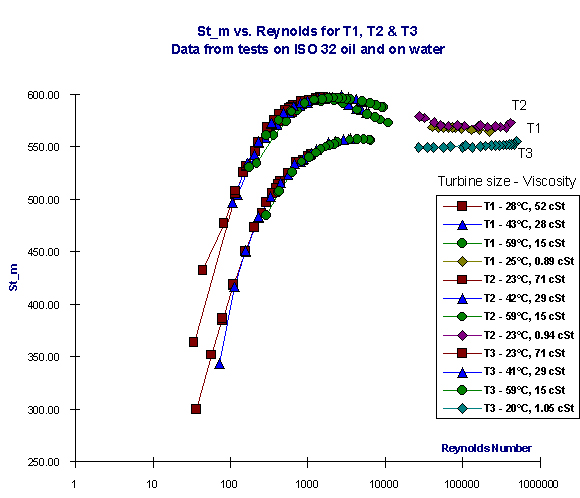
A further modification was made to compensate for the differences in pitch of the three turbines, the resulting group was then renamed St_m.
Equation 4 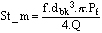
Where  is density, V is velocity, dbk is block diameter, dbd is blade diameter, is density, V is velocity, dbk is block diameter, dbd is blade diameter,  is dynamic viscosity, is kinematic viscosity, Q is volume flow rate, f is frequency, Pf is pitch factor. is dynamic viscosity, is kinematic viscosity, Q is volume flow rate, f is frequency, Pf is pitch factor.
4.3 Best of both worlds
The use of Reynolds number on the x-axis brought with it certain problems. The original k factor / flow curve used an iterative process in order to calculate flow. The U.V.C., as it only contained flow on one of the two axes, was simply a look-up chart not requiring any iteration. The St_m / Re method once again contained flow on both axes and hence required iteration. To avoid this Reynolds number was modified; flow was substituted with frequency and the group was renamed Re_m.
Equation 5 
5. Curve fitting
The curves when plotted using Re_m / St_m were very similar in shape. As a result it was possible, by varying the constants, to fit one mathematical equation, a sixth order polynomial, to all three curves. The data and fitted curves plotted on a Re_m / St_m graph can be seen in Figure 7.
Figure 7
Data and fitted curves for three different size turbine flow meters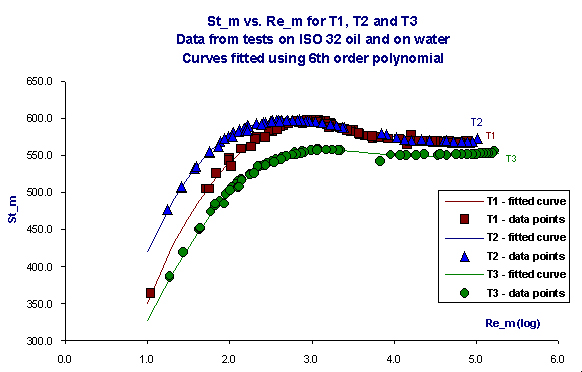
6. A design tool
The ability to plot very similar graphs for different size turbines allows the design engineer to predict the effect of changes on certain parameters. Should the need arise to alter the pitch of the turbine then the pitch factor can be adjusted and the new curve accurately predicted prior to any tests being carried out. In the same way adjustments could be made to other dimensions and the effect on the curve could be immediately seen.
7. Conclusion
The research to date has gone a considerable way to reducing the differences between linearisation curves for different size turbine flow meters. Research is continuing to further improve on this solution with the ultimate aim of plotting the data from different size flow meters in one smooth curve.
References
Hochreiter, H.M. - Dimensionless correlation of coefficients of turbine type flow meters, Trans. ASME, October 1958, pg. 1363-68.
Massey, B. S. - Mechanics of Fluids - Sixth Edition, Chapman & Hall, London, 1992.
Acknowledgements
Dr S.B.M. Beck - Lecturer in Thermodynamics and Fluid Mechanics, Sheffield University.
Mr John Price - Head of Research and Development at Webtec Products Ltd, St. Ives.
|
 Français
 Anglais
 Allemand
 Anglais US
 Espagnol